


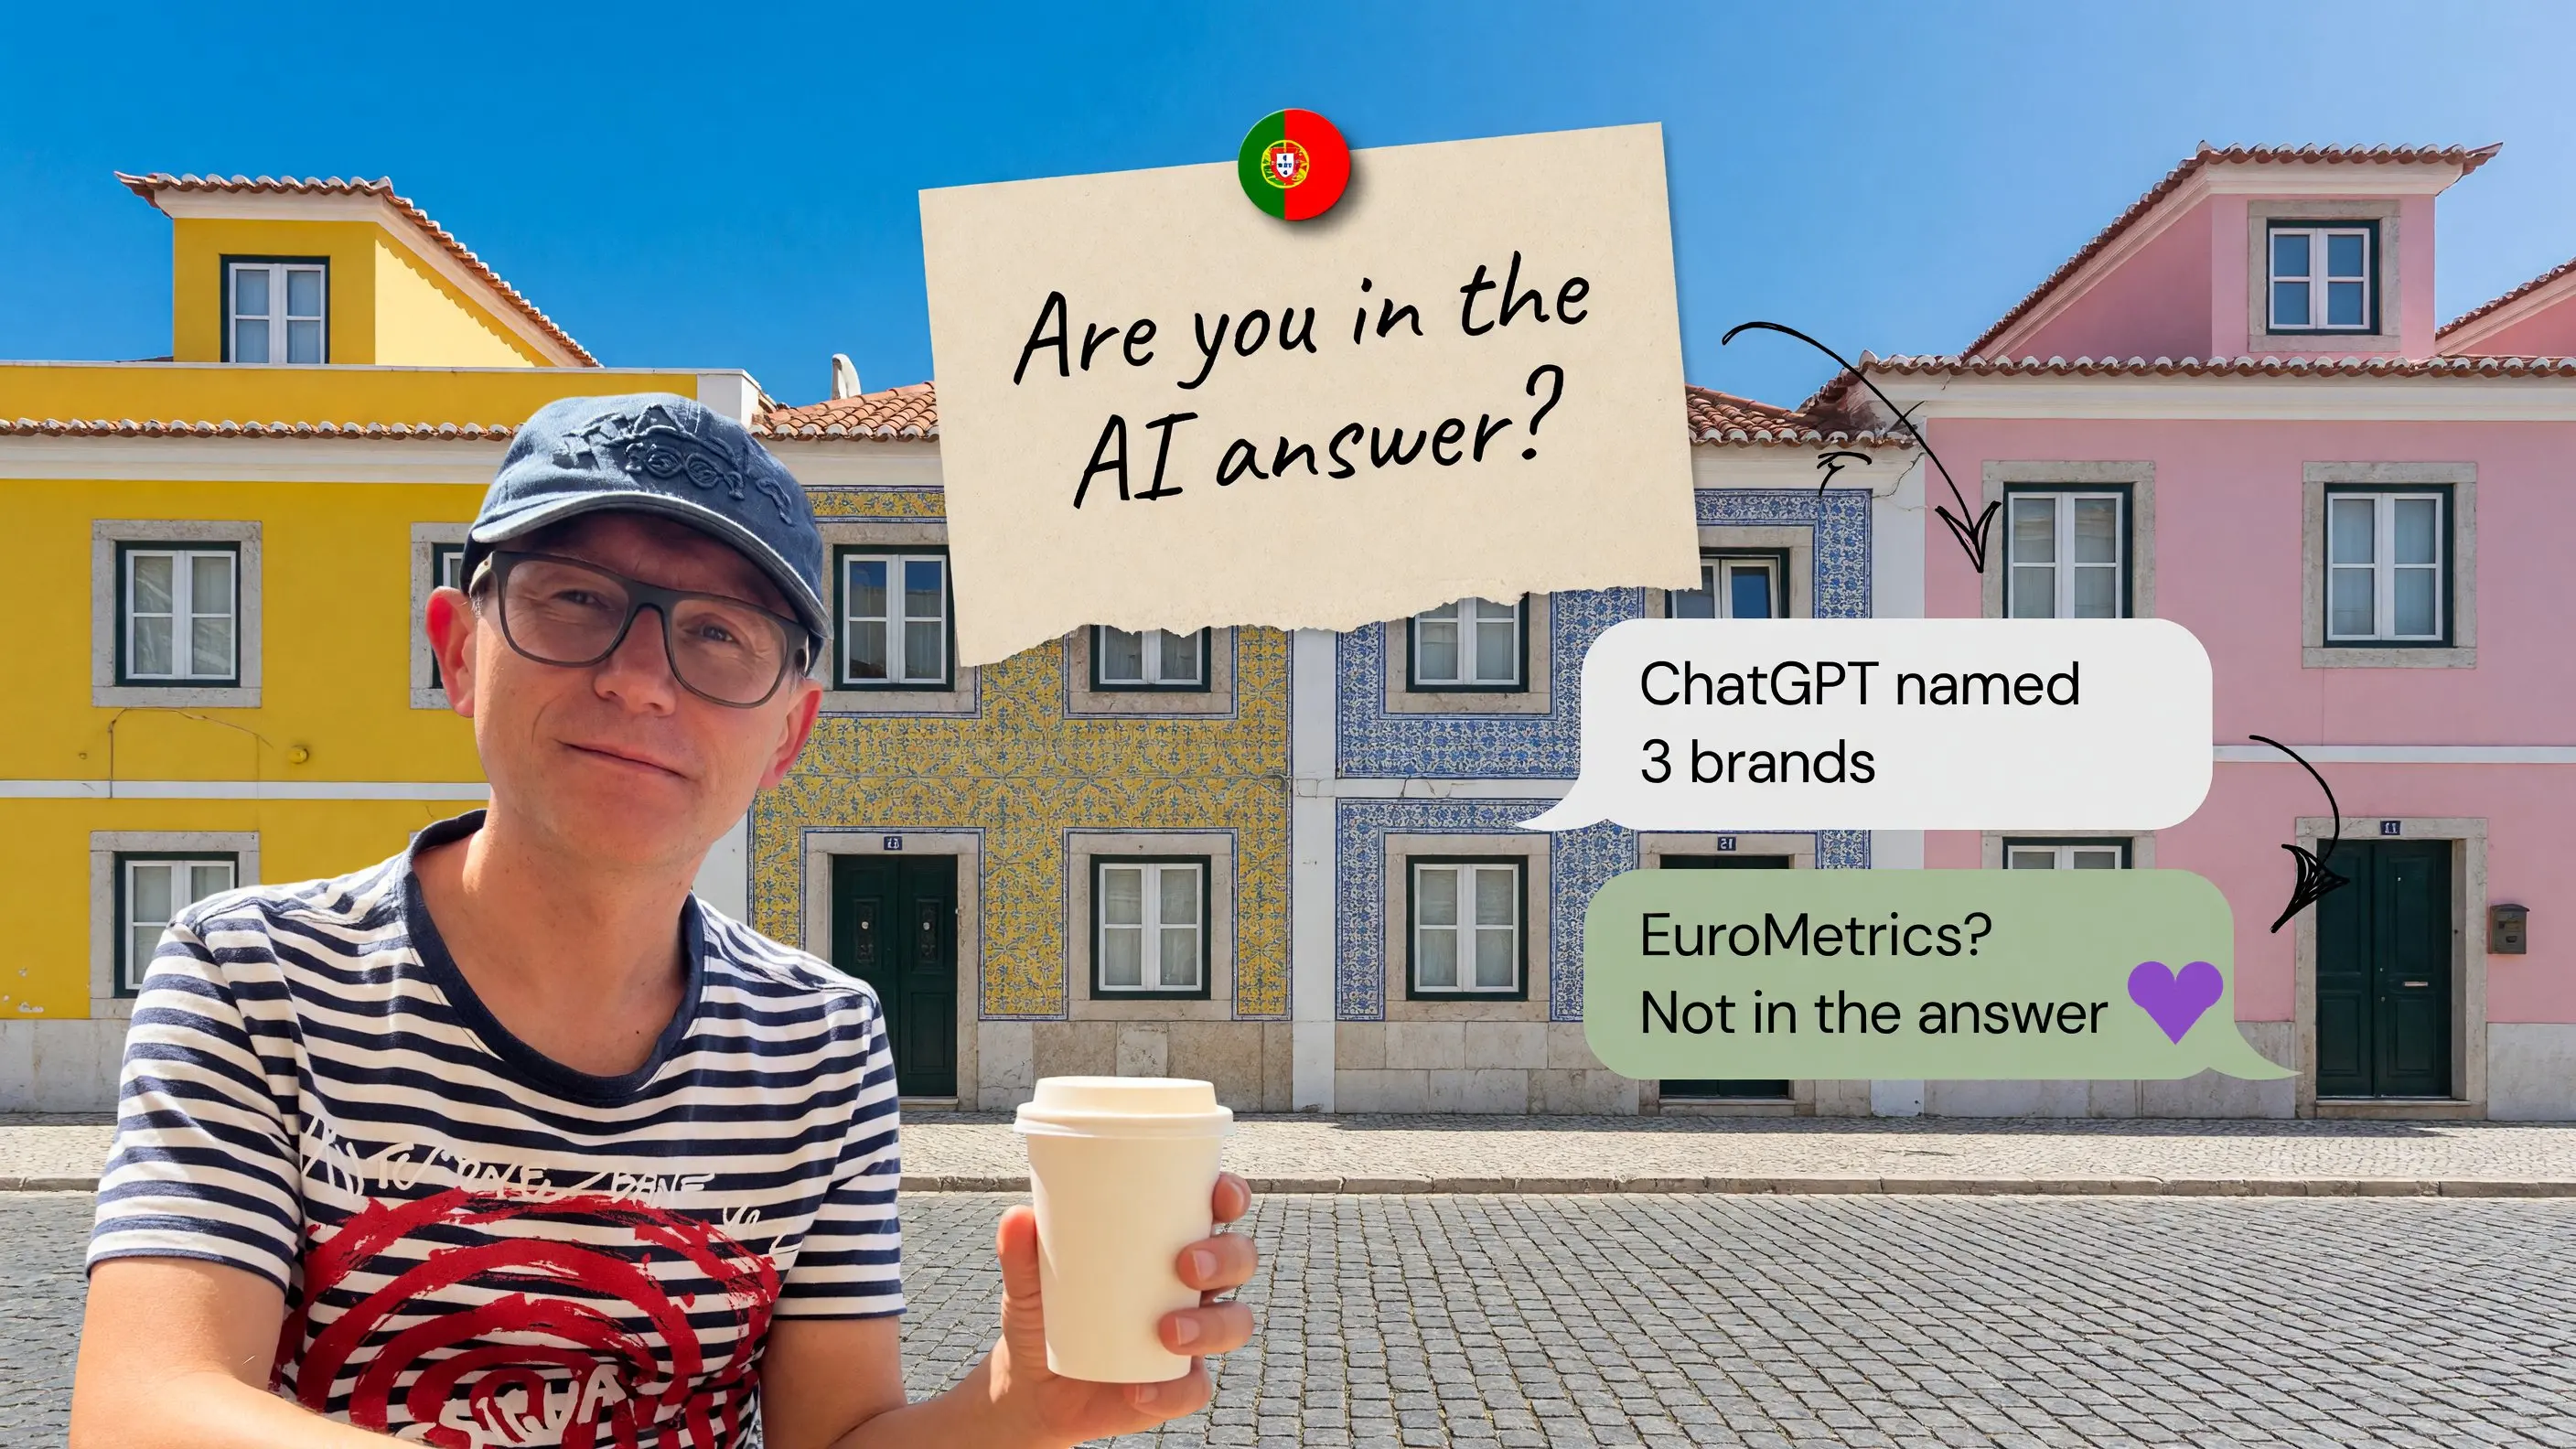
A café owner in Porto asks ChatGPT: “which guest Wi-Fi should I set up so I can build a guest database without breaking GDPR.” He gets three names, a line about each and a couple of links. He taps one. That's it — the choice is made, and the ten tabs of search results never happened.
If you're one of the three, you have a customer. If you're not, you didn't “slip in the rankings” — you simply weren't in the room. And your analytics won't tell you a thing, beyond “direct visits” being up a little this month.
How to get into the answer is a separate story — I wrote about it using the example of a site that made it into ChatGPT in 17 days. This piece is about how to measure whether you made it or not. Over the past month I've heard “we've become more visible in AI” several times — and not once with a number you could check.
Three names, or nothing
Search has ten links and a position among them. A model's answer has two or three names, or none. There is no “second page” to climb from. So the thing to measure isn't position — it's the brand's presence in the answer itself: is it named, in what order, with a link or without, and who is named next to it.
For most European markets there are several surfaces to watch: ChatGPT, Perplexity, Google's AI Overviews and the newer AI Mode, Gemini, and Microsoft Copilot. They answer differently, and you have to count them separately.
Who stands in the answer in your place is the single most useful result of the measurement. That's the real list of who you compete with. It rarely matches the one in the investor deck.
Questions, not keywords
Nobody types “guest wi-fi price” to an assistant. People ask a question with a situation, and the situation changes the answer: “where can I order 40 office chairs delivered to Lisbon by Friday,” “which CRM suits a three-chair dental clinic,” “what to give clients for the holidays on a budget of €30 a head.” Measurement starts with a list of these scenarios: who is asking, what they want, in what words. Twenty to thirty is enough for almost any business.
Two rules. Include the scenarios where you expect to lose — those are the ones that teach you. And don't change the list from one measurement to the next, or you'll be measuring your own edits instead of the trend.
Ask three times
This is the step everyone skips, and it's the one that decides whether the numbers mean anything at all.
Models are non-deterministic. Ask one question three times and you'll get three different answers — your brand in some, gone in others. A single run is a coin toss wearing a report's costume.
The fix is boring: every question is asked several times, and a spread is shown next to each percentage. Not “58%,” but “58% ± 9.” When next month reads 63, that's inside the noise. When it reads 78, something happened. Growth only counts if it's bigger than the spread. Anyone who has ever shown a “+8%” slide that evaporated on the next run knows why this matters.
What to count
Seven numbers cover almost every question marketing will ask:
Metric | Answers the question |
|---|---|
Mention rate | In what share of answers the brand is named at all |
Position | Named first or last — mean and median |
Share with a link | How often a mention comes with a link to your site |
Recommendation rate | Does the model recommend you, or just list you |
Dominance index | Your share against competitors, in one number |
Correctness | Whether the facts about the brand are right |
Spread | How stable all of this is across repeats |
Count each surface separately. Models with live search almost always link; models without it almost never do; Google's AI Overviews link but don't show on every query. An average across all of them hides exactly the difference you need to act on.
From a baseline measurement of our own guest Wi-Fi service: 72 questions across six scenarios, four models, three repeats. Mention rate 53%, dominance index 45 against 31 for the nearest competitor — not bad at first glance. But in the scenario about GDPR and data handling the brand was named in 8% of answers and never once with a link. That is what goes into the work plan — not “overall visibility 53%.”
Store the answers, not just the percentages
The most useful decision in the whole method is to keep every answer in full, with all its links. Any number can be opened back up to the text that produced it, so you can read exactly what the model got wrong: an old price, a discontinued product, someone else's claim quoted as fact.
And second: add a competitor you forgot, or a spelling of the brand the model uses, and the entire history is recomputed from the stored answers. No new runs, no broken chart.
Why the number is what it is
Low visibility almost always has a technical cause, and you can't see it from a browser: the site is served to you as a human, not as a crawler. I covered five free checks earlier. Two more.
First: Bing Webmaster Tools has an “AI Performance” report — it shows how often Copilot and Bing's AI cite your pages, and the queries behind them. It's free, and most site owners don't know it exists. It matters beyond Bing: ChatGPT's search and Copilot both lean on Bing's index, so a page that isn't indexed there won't surface in those answers. Check your coverage in Bing first.
Second takes a minute in the terminal. Request a product page as a browser and as a crawler, and compare the amount of text:
curl -sA "Mozilla/5.0 Chrome/128.0" https://example.com/product | wc -w
curl -sA "GPTBot/1.2" https://example.com/product | wc -w
If the second number is a fraction of the first, you've found the problem before you've found the competitor. From a real measurement: a large retailer serves an AI crawler 22% of the text a human sees, store addresses are hidden inside a map widget, and there isn't a line of markup saying which company the site belongs to. From the outside — it looks like any other site.
And who actually showed up
Everything above is about what the models say. It doesn't answer whether anyone came to the site afterwards — and that's exactly what the person paying will ask.
Visits from ChatGPT, Perplexity and the rest arrive with a referrer — chatgpt.com, perplexity.ai, and so on. Most analytics have no dedicated AI-traffic report: you need a segment by source domain, or it all sits in “referral traffic” next to some random forum. And some assistants — including parts of Google's AI surfaces — pass no referrer at all, or fold the visit into ordinary search. So the “AI assistants” channel is a floor, not a ceiling — and it's better to say so before the numbers reach the leadership.
Two axes side by side give you a picture you can work with. Mentions up, traffic flat — the model names you but doesn't link; work on your share-with-a-link. Mentions flat, traffic up — the model is sending people to a page you didn't expect; go and look at it.
What I do about it
This whole method is built into the AI Visibility module in EuroMetrics — our analytics for Europe. Scenarios are sent to the models on a schedule and several times each, every answer is stored with its sources, the seven metrics are computed per surface and per competitor with the spread next to each number, and visits from AI assistants sit as a separate channel in the same analytics.
Google's AI Overviews and AI Mode are the hard part: no data provider offers them cleanly, so we capture them from a real device — the answer text together with its links, by region. The method is proven; it's being built into the product now. It's too early to promise a client it's ready, and I won't.
If you'd like to see how your brand shows up in AI answers right now, get in touch. The first measurement is concrete numbers for your scenarios and your competitors, with no access to your site.